
As we all noticed, Indian markets have been correcting over the past six months, from October last year to March this year. A significant fall of 15% is considered good because the latest is due to sentimental factors, not fundamental ones.
- Geo-political (US Tariffs)
- Wars (Israel and India’s wars against terrorism)
Things have settled down over the past two months, and markets have been bullish. But what factors can we use to say that the current Indian market trend is bullish?
To answer this question, we considered three factors:
- Sentimental Factors: (Wars have almost settled down, US tariffs are being negotiated, and FIIs have started investing in India).
- Technical Factors: Golden Crossovers
- Golden Crossover is a concept in technical analysis. This indicated a long-term bull trend and a rare buy or bullish opportunity. This occurs on the Daily chart when the 50 EMA crosses the 200 EMA.
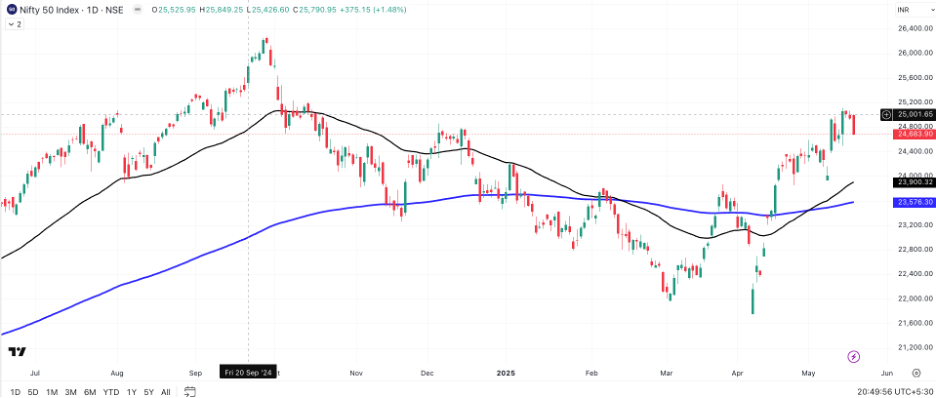
- We observed this crossover first on the Bank Nifty Daily Chart, followed by the Nifty. So we can say that Banks and Financial Services are pushing up the Nifty.
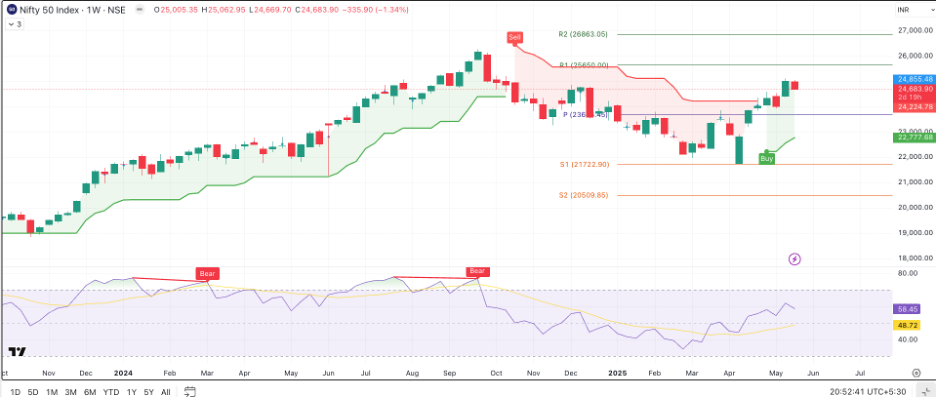
- Also, we got a second confirmation supporting our Golden Crossover, Super Trend Indicators indicating bullish on the Weekly chart, both on Nifty and Ban Nifty.
However, we should never forget that the fundamental reason should support every technical fact.
Fundamental facts:
As we all know, the key fundamental facts for Nifty are Economic Phase, GDP growth rate, inflation rate, and interest rate.
Let’s check out the fundamental factors:
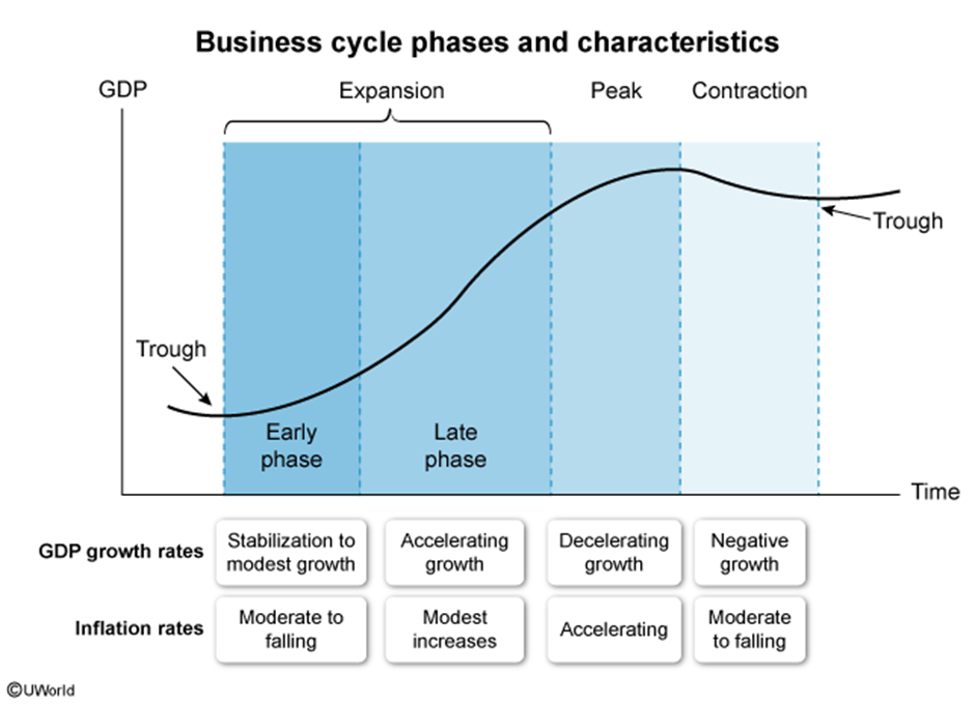
This is a general educational graph used to represent a country’s economic phases. We can identify a country’s economic phase based on GDP growth rates and Inflation rates. Below, you can see the scenarios explaining each phase of the economic cycle. Let’s use these simple parameters to identify the economic phase that India is witnessing.
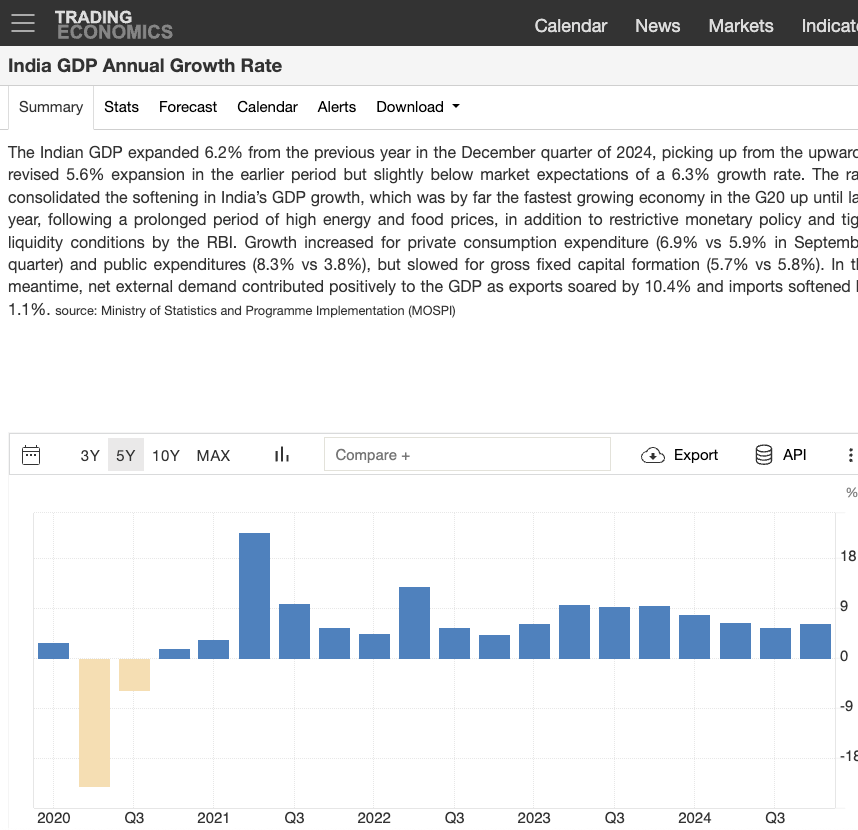
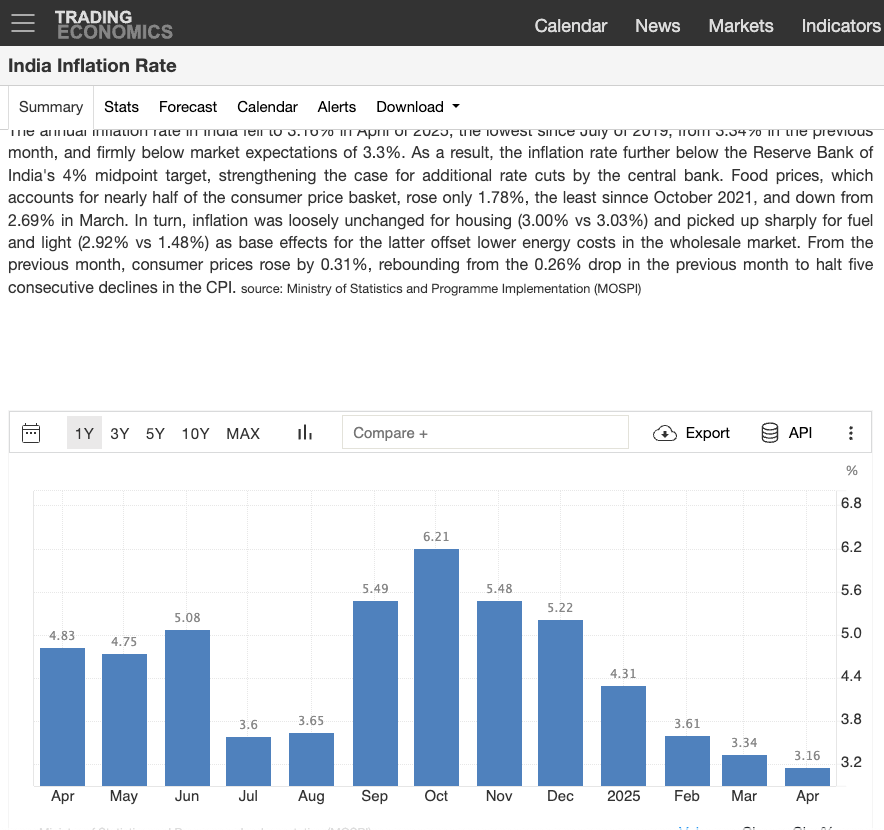
As per reliable sources, India’s GDP growth rate is stable at 6%, and the inflation rate is falling from a moderate rate of 5%. Looking at these numbers regarding the economic cycle, we can see that the Indian economy is still experiencing the early expansion phase. (Show the Business Cycle Graph here)
Economic theory states that each phase lasts about 5 to 10 years or more.
Interest Rate Analysis:
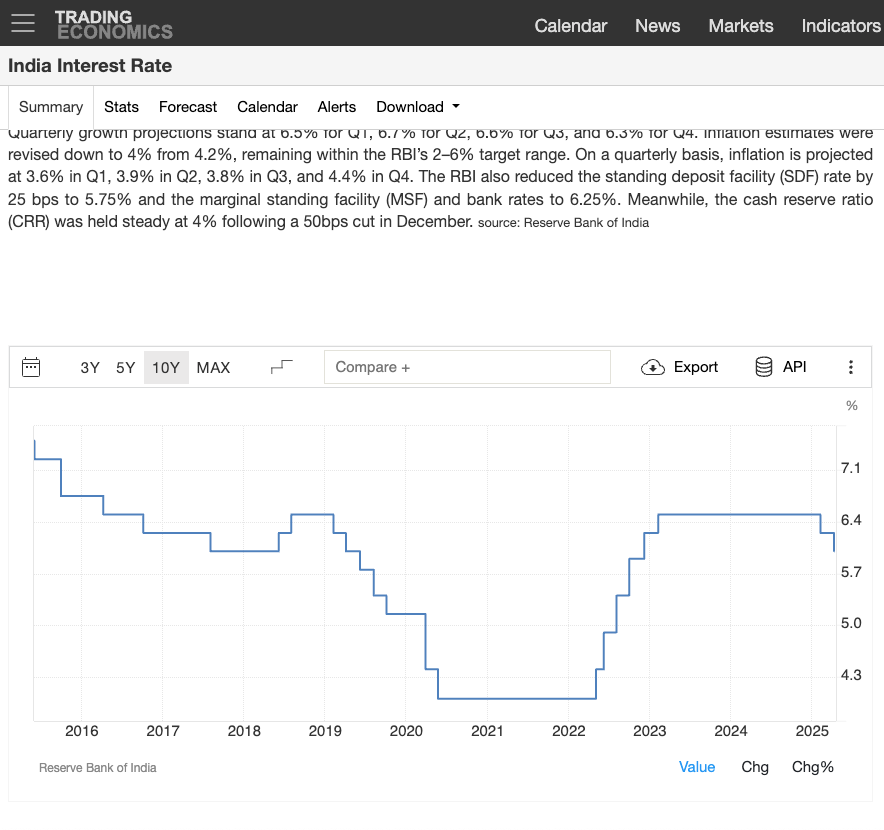
Another critical factor is that the Indian inflation rate has been constant at 6.5% for almost two years and has witnessed rate cuts by the RBI over the past few months. The current interest rates are at 6%. If Indian inflation remains under 5%, we can expect the repo rate to fall below 6%.
Considering three factors
- Sentimental factors, easing geopolitical issues,
- Technical factors (Golden Crossover on Nifty Daily chart & Super trend bullish on Nifty Weekly Chart)
- Fundamental factors (Stable GDP, Fall in interest rates, and Interest rate cuts by the RBI)
These are strong indicators that Indian markets will outperform for the next few months unless sentimental factors, like geopolitical issues, disturb them.
Considering these facts and indicators, we take a bullish stand on Indian markets. Now, let us examine which sectors support indices like Nifty and Sensex. We observed the performance of the entire Indian sectoral index over the past two months. The following are the sectors supporting,
- Bank Nifty
- Financial Services
- Oil & Gas
- Consumption and
- Auto
Other sectors, such as Metals, Energy Infrastructure, IT, and Commodities, performed well. However, according to our analysis, we observed a strong chart pattern in these five sectors.
- Banks
- Financial services
- Oil & Gas
- Consumption
- Auto.
Fundamental factors supporting these sectors: During interest rate cuts and monsoon conditions are favourable, the auto sector, finance, and banks will, of course, perform well.
Of course, oil and gas companies will perform when crude oil is trading at an all-time low and continuing a downtrend.
No tax up to Rs. 12 lacs per annum, and other Income tax benefits will save disposable income for individuals, which will help the consumption sector to perform.
Finally, considering the facts discussed, we stay bullish on Indian markets, five sectors and a few stocks. But this is entirely our research and analysis, not a recommendation. You can do your analysis using our information.
Banking Sector,
We picked a few stocks, satisfying our criteria.
- Union Bank
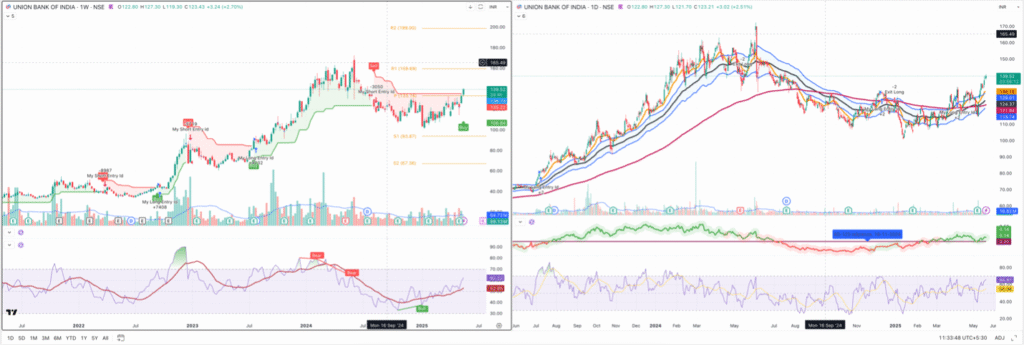
You can see the chart patterns; the left is a weekly chart, and the right is a daily chart. On the weekly chart, Super Trend indicates bullish activity with above-average volumes.
You can identify the crucial cup-and-handle chart pattern with rising volumes on the right-hand side of the daily chart. You can also see EMA crossovers with filters supporting bullish trends.
The immediate question is: Since the stock has already rallied from its low, can we invest now at this price?
This should be addressed considering two facts,
- Technical fact: On the weekly and daily charts, the RSI just crossed above 60, indicating that the stock is bullish but not overbought. But these technicians should be supported by fundamental factors, or else say no to any technicians.
- Fundamental Factor: Let us examine a few key metrics of Union Bank.
- Valuation: For banks, which should primarily look for Price to book value instead of the PE ratio,
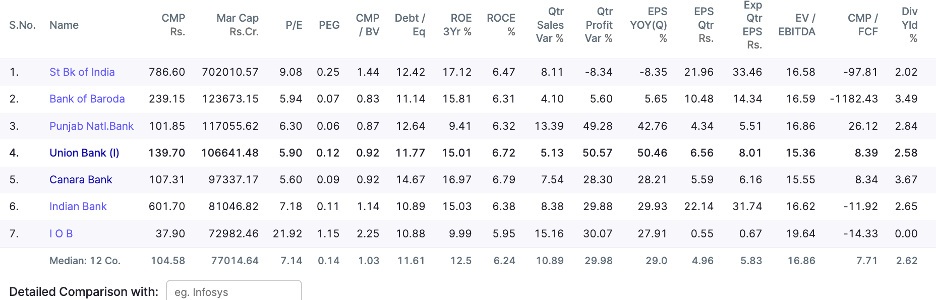
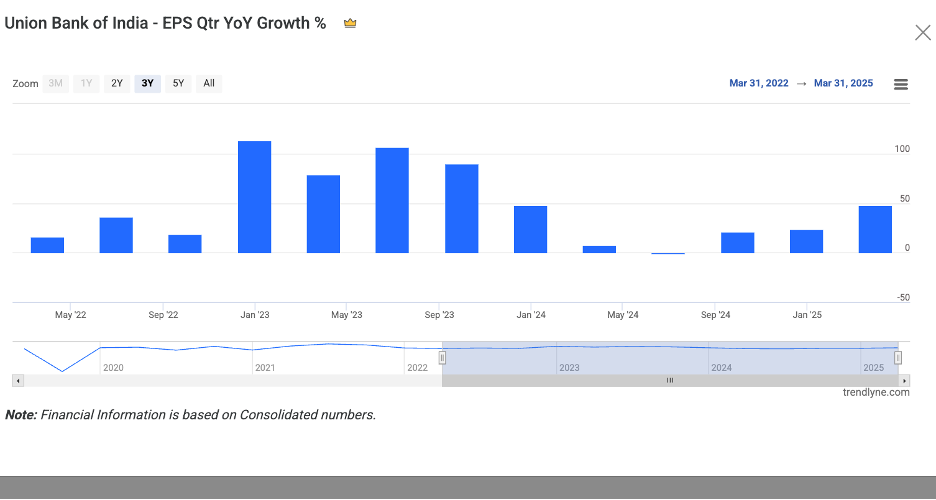
Union Bank’s book value is comparatively less than that of other banks. The PE ratio is lower than the industry average, and the PEG is much less than 1. Fine. The company is relatively undervalued. The next question about the business is that the EPS growth rate has been above 20% over the past three quarters, which indicates strong quarterly results, and the company has a history of giving even better results.
The key concern is the revenue growth rate. Although it didn’t meet our criteria of 10%, we expect it to grow with the economy’s recovery.We observed the same scenario in CANARA BANK, but we chose UNION BANK because the debt-to-equity ratio is very high for CANARA BANK.Similarly, we found similar patterns in stocks like
- TVS Motors
- MCX
- DIVI LAB
However, these are high-value stocks trading at higher valuations. Please check their historical PE ratio, PEG ratio, and other metrics before you make any conclusions. This is all about our article on Golden Crossover on Nifty & Bank Nifty. I hope you enjoyed reading it. Wishing you Good Luck